
In our most recent post, we revealed the extent of MPD’s Authorization of Agency (AoA) program, inspired by Memphis Shelby County Crime Commission (MSCCC).
We did some preliminary analysis of the data and there are updated spreadsheets (CSV, ODS, XLSX). The update includes some address corrections and the addition of a business category field.

We saw the racial disparity in the initial AoA post. The profiling nature of the scheme, with seven times (84.9% vs 12.3%) the number of Black versus white victims of AoA is confirmed.

We broke down AoAs by the year the initial AoA was signed. 2018 is low because only half a year of data was collected. Years 211 through 2016 are incomplete because we asked in our FOIA for all AoAs between December 1st 216 and July 9th 2018. All precincts but one simply sent all their AoA data rather than selecting the data range we asked for. In addition, we noted many AoAs which were signed on a given date and had additional lines added over the same signature and date later. We have not quantified this factor as of yet but we think it will skew a couple of percent of the dates earlier.
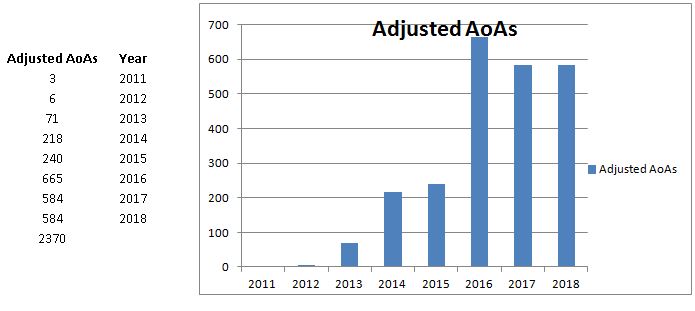
We adjusted the yearly graph by doubling up the 2018 number to estimate a full year, and we added 15% to 2016 and earlier to account for the number of AoAs missing in our sample.
The graphs look similar. From small beginnings in 2011, the scheme grew to about 240 in 2014, then took a big jump to 665 in 2016 and plateaued out to around 600 each in 2017-2018.
We need to look for the impetus behind the 2014 and 2016 bumps. Most likely, some form of marketing or promotional assets were assigned to the program to cause these bumps. We’ll also submit another ORR to obtain the missing data.

We created a new field in the spreadsheet for business category and ran this report. The biggest category is apartment, which also includes mobile home parks, condos, retirement communities and townhouses.
The dominance of this sector may be the result of “Operation Safeway” which had a focus on apartment managers. The majority of these had a just a few AoAs, but complexes like Greenbrier with 48 AoAs and a dozen or so with double digits stand out. Clearly a number of apartment managements embraced the scheme enthusiastically.
The retail sector is largely a handful of AoAs in each store. All branches of chain stores are included. Three chains of dollar stores (Family Dollar, Dollar General, and Dollar Tree) had a total of 38 AoAs, which probably reflects the dollar stores’ well known skimping on security staff. Other chains with large numbers includes Walgreens with 24 and Kroger with 17. Otherwise, few retailers had more than three or four per location.
We think that, like with the apartment sector, that the heavy retail users had an internal policy to use AoA while the light users were probably recruited by police.
The food sector includes all vendors of prepared food and alcohol by the drink. The chains with most branches are the biggest offenders, and CiCi’s Pizza in Poplar Plaza’s 17 AoAs were associated with a well-publicized disturbance at the venue. We know that Operation Safeway targeted food establishments in certain areas, but we think that most of the rest may have been instigated by MPD, including the CiCi’s incident.
The hotel/motel sector includes hotels, motels and boarding houses, has a few stand-outs, probably related to prostitution. The manufacturing sector, though small, is dominated by Smith and Nephew who initiated 85 of the 100 AoAs. This is an anomaly which probably reflects a decision in management to use MPD as part of its security apparatus.
The gas sector looks very much like retail, and when you eliminate the effect of supplier chains like Shell or Exxon, not much stands out.
Public facilities include the downtown MATA terminus, with 24 AoAs and three at the Zoo. We talked about the Zoo political blacklist in the original AoA post. We dispute the legality of public entities barring members of the public.
Churches banned 37 people. It sounds unchristian to us to put people in the system. Even worse, schools had 35 AoAs, and we cannot envision a world where young people can be legally barred from education, or even where a school would involve the police in its disciplinary process.
Summary
We see some high-frequency users of AoA. These AoAs are probably due to business policy and may have been influenced by Operation Safeway in some way. The vast majority of AoAs have the potential of being instigated by police, including a handful where we know the case history.
We will follow up with additional analysis, including enriching the data and sampling some case histories to determine the marketing initiatives that shape the AoA usage curves.
–concluded–

One thought on “Authorization of Agency: Initial analysis”